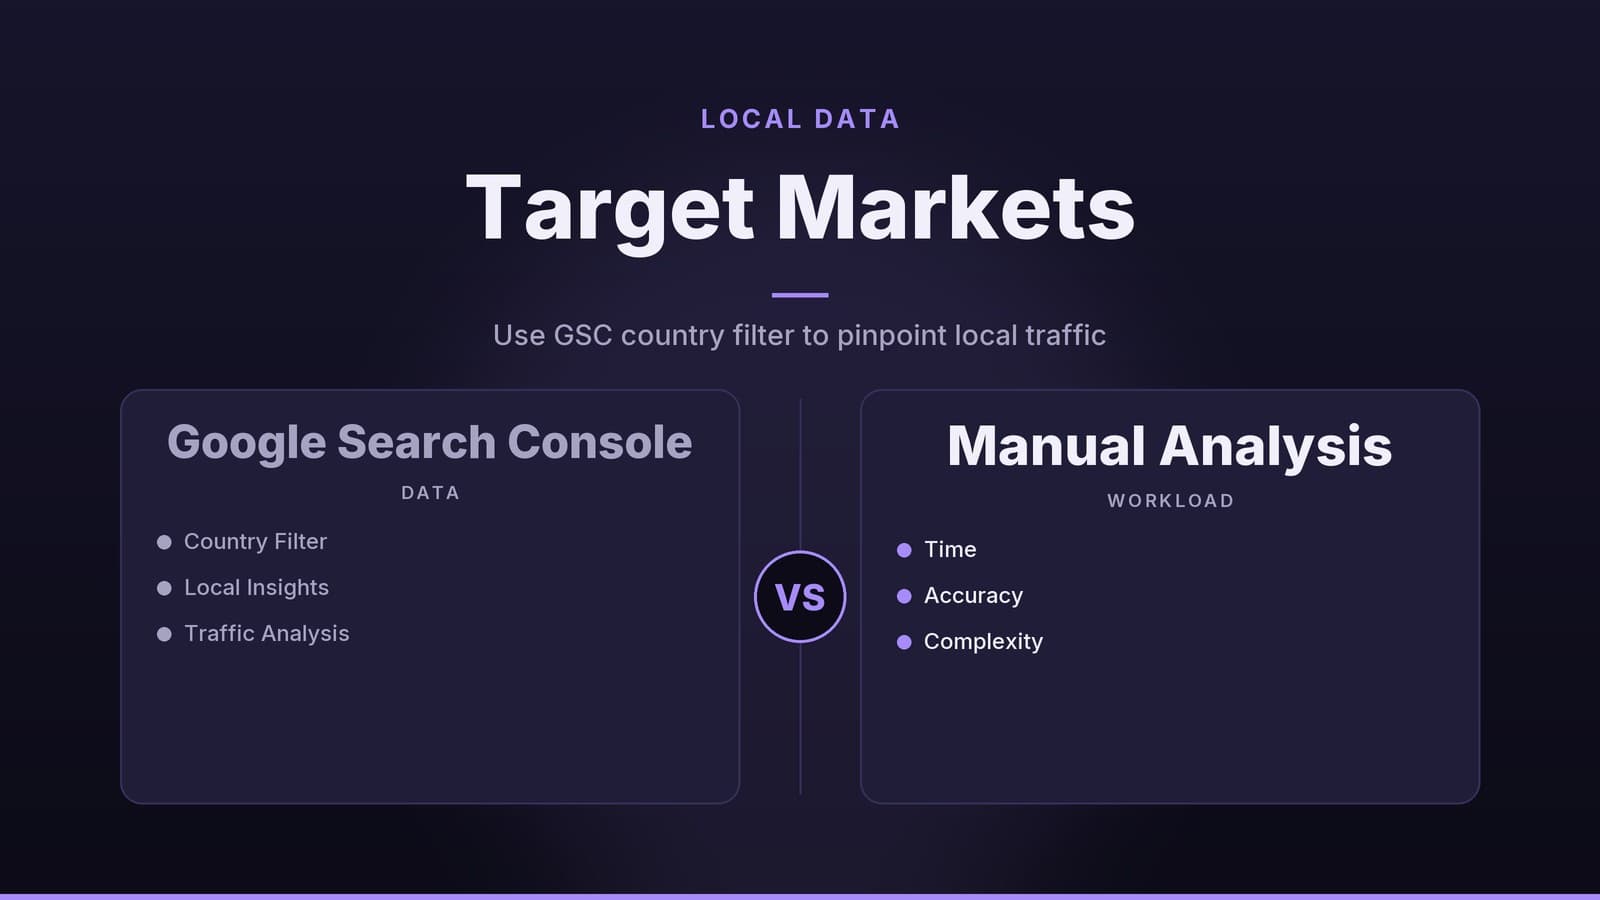
Use GSC Country Filter to Target Local Markets
Learn how to combine Google Search Console country data to analyse local traffic for your business.
Why Local Search Matters
Local search is the bridge between an online query and foot-traffic for brick-and-mortar businesses. When a shopper types “dentist near me” or “vegan pizza London”, the results that appear first are the ones most likely to be visited.
- Foot-traffic driver – For a clinic, a restaurant, or a retail shop, a local-search click often leads to an appointment, a reservation, or an in-store purchase.
- Spend prioritisation – Knowing which country or region generates the most clicks helps you direct ad spend, local listings, and content creation toward the markets that deliver the most traffic.
- Combined view in Google Search Console (GSC) – GSC offers a filter that allows you to view traffic from multiple countries within the Performance report, helping you understand overall trends across your target markets.
Tip: If you already use a local-SEO tool, compare its country-level data with GSC’s combined view to spot discrepancies early. (See our guide on Choose the Right Local SEO Software for Your Small Business.)
Getting Started with the New Country Filter
- Open the Performance report – Log into GSC, select the property you want to analyse, and click Performance in the left-hand menu.
- Click the globe icon – This opens a pane with two tabs: Filter and Compare.
- Use the Filter tab –
- Tick the checkboxes next to the countries you serve.
- GSC displays the metrics for the selected group.
- The chart and table above the pane refresh to show the data for your selection.
Quick checklist
| ✅ | Action |
|---|---|
| 1 | Open Performance report |
| 2 | Click the globe icon |
| 3 | Choose the Filter tab |
| 4 | Select the countries you want to review |
| 5 | Review the metrics for that selection |
The filter works similarly to the standard country selection, so users familiar with GSC will feel comfortable right away.
Filter vs. Legacy Single-Country View – A Side-by-Side Comparison
| Feature | Legacy single-country filter | New multi-country filter |
|---|---|---|
| Countries selectable | One at a time | Multiple countries |
| Data aggregation | View data for one specific market | View data for a group of selected markets |
| Time to view combined data | Requires switching between views | Updates instantly upon selection |
| UI differences | Standard filter pane | Same pane, with multiple checkboxes |
| Use case | Quick look at a single market | Quick overview of a regional cluster (e.g., UK + Ireland + Malta) |
How it stacks up against other SEO tools
| Tool | Multi-country aggregation | Export format | Typical cost model* |
|---|---|---|---|
| Google Search Console | Built-in filter for country selection | CSV, Google Sheets | Free (part of Google Search ecosystem) |
| Ahrefs | Country-level traffic data available in reports | Check vendor for current export options | Subscription, per-user pricing |
| SEMrush | Country-level reports available | Check vendor for current export options | Subscription, per-user pricing |
*We do not list exact prices; most tools charge per user per month. Check each vendor’s pricing page for current rates and specific feature availability.
Using the Compare Tab to Spot Differences
The Compare tab lets you examine markets side-by-side.
- Select countries – Choose the markets you want to contrast.
- Read the “Difference” column – Positive numbers indicate where the first selected country leads; negative numbers indicate where it lags.
- Interpret the gaps –
- Click gap (large difference, small impression gap) → possible CTR issue, maybe the meta title isn’t resonating locally.
- Impression gap → the site may be less indexed for local language variations.
- Position gap (higher average position number) → deeper ranking, suggesting a need for more location-specific content or backlinks.
Example comparison table
| Metric | Country A | Country B | Difference (A – B) |
|---|---|---|---|
| Clicks | 1,200 | 800 | +400 |
| Impressions | 15,000 | 14,500 | +500 |
| CTR | 8 % | 5.5 % | +2.5 % |
| Avg. position | 4.2 | 6.8 | –2.6 |
Because the Compare view is limited in how many items it displays at once, you may need to repeat the process for additional markets or export the filtered data for deeper analysis (see the “Next Steps” section).
Practical Steps for Different Business Types
Below are concrete ways small-business owners can turn the filter and compare features into actionable insights. Adjust the country sets to match where you actually operate.
| Business type | Filter use (combined view) | Compare use (side-by-side) | Typical decision triggered |
|---|---|---|---|
| Clinic | Combine UK, Ireland, Malta to see total health-service queries. | Compare UK vs. Ireland to spot where “online appointment” searches are higher. | Shift Google Ads budget toward the country with stronger appointment intent. |
| Restaurant | Filter Italy, Spain, France to gauge interest in “vegan pizza” or “gluten-free menu”. | Compare Italy vs. Spain to see which market clicks more on menu pages. | Add a locally-optimised menu page for the lagging country or run a geo-targeted promotion. |
| Retail shop | Combine Germany, Austria, Switzerland to understand seasonal product demand (e.g., “winter coats”). | Compare Germany vs. Switzerland for average position on product pages. | Decide whether to ship stock to a Swiss warehouse or adjust on-site SEO for Swiss-German keywords. |
| Service firm (e.g., logistics) | Filter Poland, Czech Republic, Slovakia to see total query volume for “freight forwarding”. | Compare Poland vs. Czech Republic for CTR on service-type pages. | Tailor landing-page copy to the market with lower CTR, perhaps adding local case studies. |
Checklist for a Clinic
- Open Performance → Filter and tick United Kingdom, Ireland, Malta.
- Note the clicks and impressions for “dentist appointment” queries.
- Switch to Compare, select United Kingdom and Ireland.
- Look at the Difference column for CTR. If the UK CTR is lower, test a new meta title that highlights a locally trusted credential (e.g., “NHS-registered”).
- Export the filtered data (download icon) and paste into Google Sheets. Create a simple line chart to watch weekly trends.
Checklist for a Restaurant
- In Filter, choose Italy, Spain, France.
- Observe which country contributes the most clicks for “outdoor seating”.
- Use Compare to pit Italy against Spain; note any position gap for “vegan pizza”.
- If Spain ranks lower, consider adding content that addresses local search trends in that specific region.
- Monitor GSC alerts for any sudden changes in traffic from that region (see “Next Steps”).
Limitations and Work-arounds
| Limitation | Impact | Work-around |
|---|---|---|
| Compare view has a limit on the number of items displayed | No multi-way side-by-side view for large groups | Use the Filter tab to view combined data, then export the data and compute custom differences in a spreadsheet. |
| Device, search-type, and appearance filters follow similar display rules | You cannot compare many device types simultaneously | Prioritise the device that drives most traffic (often mobile) and run separate comparisons for desktop and tablet. |
| No regular-expression support for country selection | Cannot apply pattern-based country groups (e.g., “Northern Europe”). | Use the checkboxes for selection; if you need finer regional data, filter by page URL that contains the region name. |
| Export format varies | May require manual formatting for advanced visualisations | Import the exported data into a BI tool (e.g., Google Data Studio) for richer dashboards. |
Note: The GSC interface may update over time. If you notice changes in how comparisons or filters work, revisit the settings to see if new capabilities have been added.
Next Steps for Your Marketing Plan
1. Export combined country data
- In the Performance report, click Export → Google Sheets (or CSV).
- Build a simple trend chart:
- X-axis – weeks or months.
- Y-axis – clicks or impressions.
- Separate series for each country or for the combined total.
2. Set up alerts
GSC can email you when a metric drops significantly.
- Go to Settings → Alerts.
- Choose the metric (Clicks, Impressions, or CTR).
- Set a threshold that makes sense for your business baseline.
- Select the country or scope you want to monitor.
Disclaimer: The threshold you choose should reflect your own performance baseline. We do not claim a specific percentage is optimal for every business.
3. Review ad spend allocation
If the combined data shows that a particular market delivers a disproportionate share of clicks relative to current ad spend, consider reallocating part of the budget.
Example: A restaurant sees a significant portion of its clicks coming from Spain but only a small fraction of its Google Ads budget is spent on Spanish-language campaigns. A modest shift of budget toward Spanish ads could improve overall ROI, but you should discuss any re-allocation with a financial professional.
4. Iterate on local content
Use the Query filter together with the country filter to discover high-volume search terms in each market.
- A retail shop might notice a summer spike in “water-proof hiking boots” in Austria, prompting a timely blog post or product-page update.
- A logistics firm could see a rise in “customs clearance Poland”, suggesting the need for a dedicated FAQ page.
5. Document findings
Create a one-page “Country Performance Summary” that records:
- Date of the last export.
- Top-performing country and its key metrics.
- Action items (e.g., “Add German-language FAQ for Switzerland”).
Keeping this summary up to date makes it easy to track progress and to brief team members who may not be familiar with GSC.
How HeyGrowin Can Help
HeyGrowin builds websites, AI-driven chatbots, and custom software that integrate directly with Google Search Console data. We can set up automated dashboards, alerts, and localisation tools so you spend less time exporting spreadsheets and more time serving local customers. Learn more at https://heygrow.in.
Frequently asked questions
Can I filter by more than three countries?
No, the Filter tab allows up to three countries at a time. For more, you’ll need to run separate reports and combine the data manually.
Does this affect device filters?
The update mentions devices, but the current documentation only shows country filtering. Check the help page for any device‑filter changes.