Retail KPIs: 5 Essential Metrics to Track Weekly
Stop guessing your store's health. Learn the five key financial KPIs every small retail owner should check every week to spot problems early.
Why Weekly Tracking Matters More Than Monthly Reports
Many small business owners wait for the month-end bank statement or the quarterly tax report to get a pulse on their performance. While this provides a comprehensive view, it often arrives too late to prevent immediate financial strain. Data from the previous month is historical; it tells you what happened, but it does not help you stop the bleeding in the current week.
Weekly tracking shifts your focus from post-mortem analysis to active management. The primary advantage is speed. If sales dip, you have days, not weeks, to respond. You can adjust staff scheduling, launch a quick promotion, or reorder stock before a minor issue compounds into a cash flow crisis.
The goal is not to micromanage every transaction, but to catch trends early. For instance, a boutique owner might notice that Average Transaction Value (ATV) consistently drops on Tuesdays. With weekly data, this pattern becomes visible quickly. The owner might respond by scheduling their most experienced sales associate on Tuesday shifts or launching a specific "Mid-Week Offer" to encourage larger baskets. Without weekly tracking, this trend might be buried in a flat monthly average, remaining invisible until the quarter ends, by which time the lost revenue is already gone.
The Core Four: Diagnosing Store Efficiency
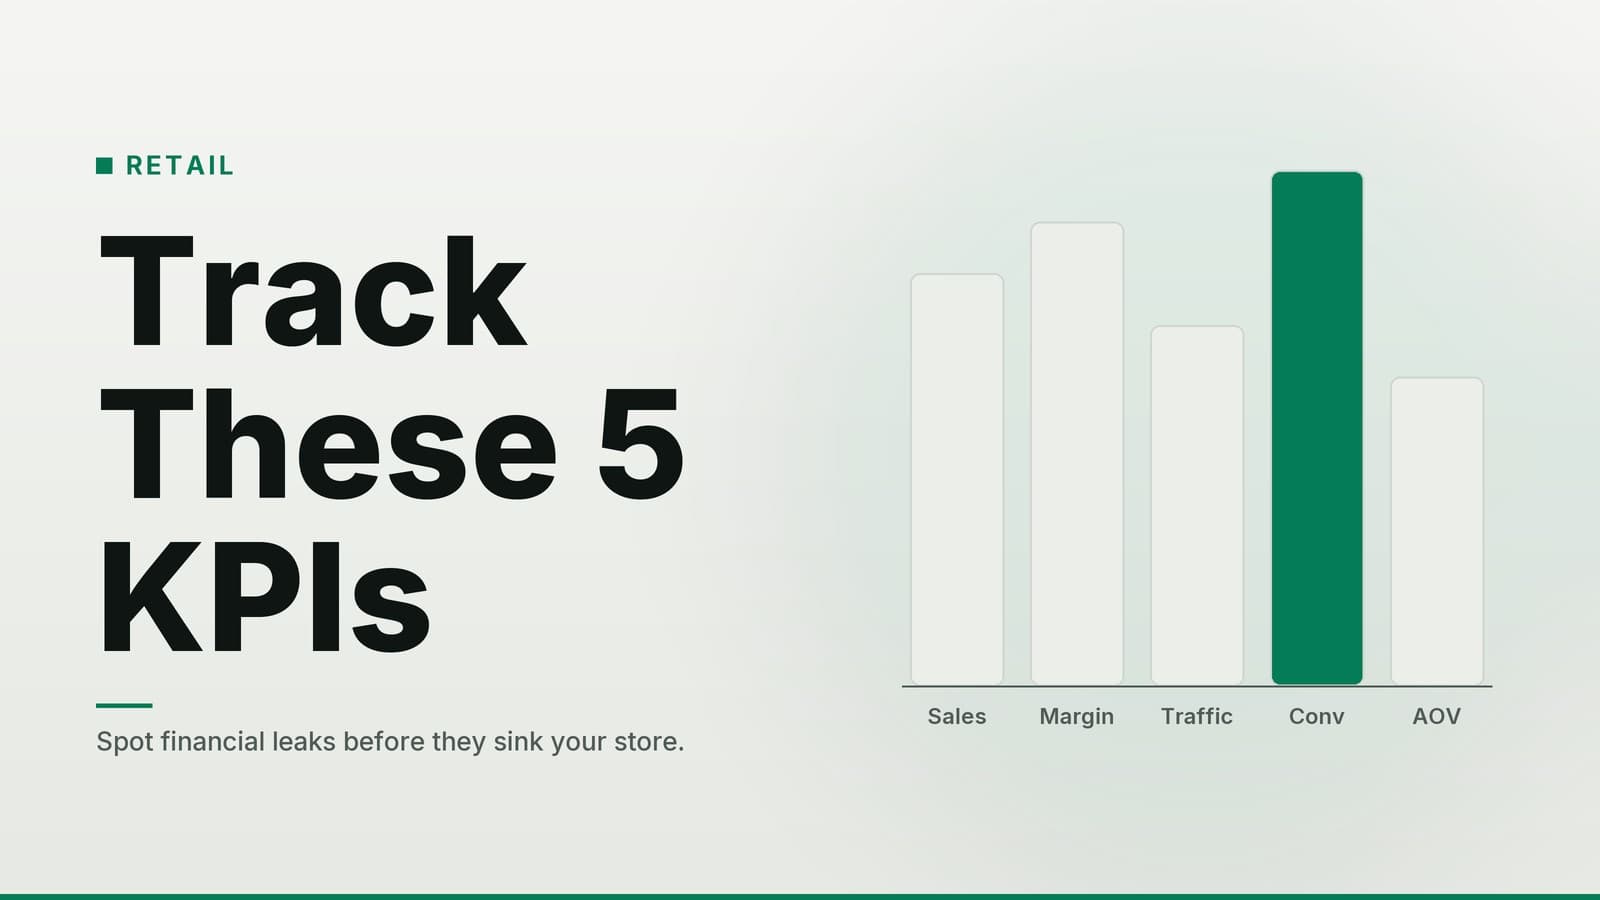
To understand the health of a retail or service operation, you need to look beyond the total number at the register. You need to break down how that number was generated. Four core metrics tell the story of your store’s efficiency.
- Net Sales: This is your total revenue after deducting returns, discounts, and voids. It is the top-line number, but it is a blunt instrument. It tells you what you made, but not how.
- Customer Traffic (Footfall): The number of people who entered your store or visited your site. This is crucial for evaluating marketing effectiveness.
- Conversion Rate: The percentage of visitors who actually make a purchase. The formula is
(Transactions / Traffic) x 100. - Average Transaction Value (ATV): Total sales divided by the number of transactions. This shows how much each customer spends per visit.
These metrics work together to isolate problems. If traffic is high but sales are low, the issue is likely not visibility; it is inside the store or on the website. If traffic is low but conversion is high, your marketing is not reaching enough people.
| Metric | What It Measures | Formula | Diagnostic Focus |
|---|---|---|---|
| Net Sales | Total revenue after adjustments | (Gross Sales - Returns - Discounts) | Overall demand and pricing power. |
| Traffic | Store visibility and appeal | Count of entries | Marketing reach and local footfall. |
| Conversion Rate | Sales effectiveness | (Transactions / Traffic) x 100 | In-store experience, pricing, or stock availability. |
| ATV | Customer spend per visit | (Net Sales / Transactions) | Up-selling success and product mix. |
Consider a restaurant operating on similar logic. If their weekly ticket count (traffic) is steady but Net Sales drop, they should look at ATV. Perhaps customers are skipping the dessert course or ordering cheaper entrees. This specific insight allows for targeted action, such as featuring a high-margin dessert on the menu board, rather than a vague decision to "do better."
Inventory and Cash Flow: The Hidden Health Check
Retail and service businesses are often cash-conversion games. You spend cash to buy stock or supplies, sell them, and receive cash back. If this cycle slows down, your business can face liquidity issues even if sales look healthy on paper.
Inventory Turnover and Days of Inventory
Inventory Turnover measures how fast you sell through your stock. High turnover generally indicates strong demand. However, if it is extremely high, you might be running out of your best-selling items, which means you are missing out on potential sales.
Days of Inventory tells you how many days of stock you currently have on hand. This is critical for cash flow. If you have 120 days of inventory, you have tied up approximately four months of cash in boxes sitting on shelves. For a small business with tight working capital, this is a significant risk.
Note: The ideal number of days varies significantly by industry. A grocery store aims for very low days of inventory to prevent spoilage, while a jeweller might hold stock for months. Always compare your days of inventory against your specific industry norms or your own historical best performance, rather than using a universal rule of thumb.
Gross Margin vs. Net Profit
Gross Margin is the profit left after subtracting the Cost of Goods Sold (COGS) from Net Sales. It is the most important metric for knowing if you are actually making money on each sale.
It is important to distinguish Gross Margin from Net Profit. Net Profit includes fixed costs like rent, wages, utilities, and software subscriptions. A business can have a healthy Gross Margin and still lose money if its fixed costs are too high. Conversely, a low Gross Margin means you need to sell a lot more volume to cover those fixed costs.
A weekly review of these metrics allows for immediate corrective action. For instance, if a grocery store notices that its Gross Margin on fresh produce has dropped, it might be due to spoilage (waste) or supplier price increases. The owner can then adjust ordering quantities or renegotiate with suppliers the following week. In contrast, a jeweller might track Days of Inventory to ensure they aren’t holding too much high-value stock that ties up their cash line, allowing them to reinvest in marketing or new stock instead.
If you are struggling to link your sales data to your inventory costs accurately, it may be time to review your systems. The right point-of-sale (POS) system can automate these calculations, reducing the risk of manual error. When evaluating POS options, check which integrations and reporting features are included in the current plan.
Setting Up Your Weekly Dashboard
You do not need enterprise-grade business intelligence software to track these Key Performance Indicators (KPIs). For most small and medium-sized businesses, a structured approach using existing tools is sufficient and more sustainable.
Tools and Automation
Start with what you have. If your POS system allows you to export daily or weekly reports, use that. Link these exports to a simple spreadsheet.
- If your POS has automation: Check if your vendor offers a recurring email report. If so, set it to land in your inbox every Monday morning.
- If you are manual: Block out 30 minutes every Monday morning. Treat this block with the same importance as a customer meeting. Do not skip it.
Benchmarking: Week-over-Week vs. Year-over-Year
Raw numbers are meaningless without context. When you look at your weekly data, always compare it to two benchmarks:
- Week-over-Week (WoW): This shows short-term trends. Did you do better or worse than last week? This is useful for spotting immediate issues like a staff shortage or a local event.
- Year-over-Year (YoY): This accounts for seasonality. A drop in sales in November might look alarming in isolation, but if you had a similar drop the previous year, it is normal seasonal behavior. A drop this year that is significantly larger than last year is a warning sign.
For seasonal businesses, YoY is often more informative than WoW. For example, a ski shop’s sales will naturally drop in July. Comparing July this year to July last year gives a clearer picture of performance than comparing July to June.
Defining "Red Flag" Thresholds
For each KPI, define a specific threshold that triggers an investigation. Vague goals like "improve sales" are not actionable. Specific triggers are.
- Conversion Rate: If it drops below your established baseline, review staff training, store layout, or website usability.
- ATV: If it drops by more than 5% WoW, check if a popular mid-tier item is out of stock or if a discount was applied incorrectly.
- Gross Margin: If it falls below your target percentage, audit recent supplier invoices and waste logs to identify the cause.
Note: There is no universal "good" or "bad" number for these metrics. A 20% conversion rate might be excellent for a high-end boutique but poor for a fast-fashion retailer. Use your own historical data to set your baselines.
Keep It Simple
Trying to track everything at once is a common pitfall. Start with just two metrics: Net Sales and Gross Margin. Master these first. Understand how they move and what drives them. Once you are comfortable interpreting these, add Traffic and Conversion. Finally, add Inventory metrics once your stock levels are stable.
If you are finding that your customer data is siloed and making it hard to understand who is buying, consider how your current systems integrate. Understanding your customer base is vital for improving ATV. You might find that a lightweight CRM helps you segment your customers better. When selecting a CRM, look for tools that integrate easily with your existing POS and payment processors to avoid data entry errors.
A Note on Digital Channels
If your business has an online component, or if you use WhatsApp for customer communication, remember that digital interactions also impact your KPIs. For example, if you are using WhatsApp to send promotional offers, track how many of those messages lead to a store visit or an online sale. This helps you calculate the true cost of acquisition. Be mindful of the operational costs involved in these channels; ensure your marketing spend isn’t silently eroding your Gross Margin.
The Weekly Ritual
Here is a practical checklist for your Monday 30-minute session:
- Open your dashboard or spreadsheet.
- Check Net Sales and Gross Margin. Are they above your target?
- Look at Traffic and Conversion. If Sales are down, is it because fewer people came in, or because fewer people bought?
- Check Inventory Days. Do you have too much stock of a slow-moving item?
- Set One Action Item. Do not try to fix everything. Pick the biggest leak. If Conversion is down, schedule a staff meeting to discuss floor training. If Inventory is high, plan a clearance sale.
- Close the file.
Consistency is key. A perfect dashboard that you check once a month is useless. A simple spreadsheet that you review every Monday is powerful. By making these numbers part of your weekly routine, you move from reacting to problems to managing your business proactively. You will spot trends earlier. You will know if your marketing is working. That is the difference between running a shop and running a business.
Frequently asked questions
What is a good conversion rate for a retail store?
There is no single 'good' number as it varies wildly by industry. A high-end jewelry store might have a 5% conversion rate, while a fast-fashion shop might see 30%. The most important thing is tracking your own trend over time.
Do I need to track these if I have an online store too?
Yes, but you should track them separately first. Online and offline customers behave differently. Once you have stable data for both, you can look at blended metrics to see how they support each other.
How do I calculate Cost of Goods Sold (COGS) if I buy from multiple suppliers?
Track the purchase price for each item in your inventory system. When an item is sold, your POS should automatically deduct that specific cost. If you use a spreadsheet, you must manually update the cost price whenever you receive a new invoice from a supplier.